Title: Measuring consumers participation in retail loyalty programmes in the South African Ngaka Modiri Molema District
Mr AT Chauke
North-West University (Mafikeng Campus), South Africa
aubreychauke112@gmail.com
orcid.org/0000-0002-4792-7255
Dr AS Pelser
North-West University (Mafikeng Campus), South Africa
aspelser@hotmail.com
orcid.org/0000-0002-0384-5901
Ensovoort, volume 43 (2022), number 7: 7
Abstract
Loyalty programmes are incentives used by businesses to boost sales, profitability, and long-term customer relationships. Protea Hotels launched the first loyalty programme in South Africa, Protea Prokard in 1986. Twenty-eight years later, in 2014, it was estimated that more than 100 loyalty programmes in various industries were running in South Africa. In 2013, over 82 million South Africans were enrolled in loyalty programmes. The primary goal of the study reported in this paper was to evaluate the extent to which employed residents in Ngaka Modiri Molema District participated in loyalty programmes. A quantitative research design was used. The study used a descriptive research method to assess and explain the extent to which employed residents of Ngaka Modiri Molema District participated in loyalty programmes. Out of the 598 responses received, 286 questionnaires were not responded to, 312 were accepted, approved, and used. Participants in the study were required to be Ngaka Modiri Molema District residents who were working and aged 20 to 54 years on the basis that they are working and made major household purchasing decisions. The findings demonstrated that most loyalty programmes in which respondents were members and benefited the most (82%) were in the retail grocery and health industries. Pick n’ Pay Smart Shopper, Shoprite Xtra Savings, Clicks Clubcard, and Dis-Chem Benefits were the most popular loyalty programmes among respondents. The study’s limitation is that it was conducted primarily through a survey in the Ngaka Modiri Molema District of the North West Province; thus, the findings cannot be extended to the rest of the country. The study revealed various obstacles that prevented employed Ngaka Modiri Molema District residents from enrolling in loyalty programmes, such as not understanding what loyalty programmes are and lack of detailed explanations by the cashiers. Based on this study, it could be recommended that managers must train their employees about loyalty programmes, define clear objectives for the business, as well as define clear benefits for the business and customers. Adding to that, some loyalty programmes offered in South Africa such as those based in the banking, hospitality, clothing and other industries need to be enhanced.
Key Concepts: Customers, customer satisfaction, customer loyalty, and customer loyalty programmes.
1. Introduction
The use of loyalty programmes has globally increased over the years. Customers are now buying goods and services with the expectation of being rewarded for their purchasing efforts. Businesses generally introduce loyalty programmes to increase their sales, profitability, and to strengthen long-term relationships between businesses and loyal customers. Different loyalty programmes are being offered in a variety of industries such as retail grocery, retail clothing, retail banking, fast food industries, hospitality industries and credit-card organisations.
The number of people who are using loyalty programmes in the world has been growing over the years. According to Colloquy (2015), the United States of America had 3.3 billion people registered in loyalty programmes. Furthermore, an average household in the United States had an average of 29 loyalty programmes. In South Africa, more than 100 loyalty programmes were operating in 2014 (Olivier & Burnstone, 2014). Additionally, an average household in South Africa had an average of four loyalty-programme memberships.
Problem Statement
Although some researchers have focused on the use of loyalty programmes in South Africa (The Truth & BrandMapp loyalty whitepaper, 2016; Eighty20 & Tritech Media, 2018; PWC, 2017; Nielsen, 2017; Meyer, 2012; Singh, 2017; Dlamini, 2016; Businesstech, 2018; Kasai and Chauke, 2017), little is known about the participation in loyalty programmes by the residents in rural areas such as Ngaka Modiri Molema District. Loyalty programmes have mostly been used by people who are based in urban areas, and as a result, most studies on loyalty programmes have been conducted in urban areas in South Africa.
Loyalty programmes have been crucial to customers by providing benefits economically through cash discounts, cash savings, and socially through experiencing a sense of belonging when meeting customers who have similar interests. Additionally, customers also benefit psychologically when businesses offer distinct treatment that ordinary customers do not receive (The Truth and BrandMapp Loyalty Whitepaper, 2016:9). Loyalty programmes are beneficial to businesses through influencing customers to purchase repeatedly and establishing long-term relationships with the businesses (Lewis, 2004; Kang et al., 2015; Magatef & Tomalieh, 2015). Moreover, loyalty programmes benefit businesses by keeping current customers and attracting new ones (Sungirirai et al., 2017).
Although customer memberships in loyalty programmes have increased over the years, the number of people participating in those programmes has declined over the years. Although it was reported that an average household in the United States has 29 loyalty programmes, only half of those loyalty programmes are used by the households (Colloquy, 2015). In a study conducted by Eighty20 and Tritech Media (2018), 48% of respondents indicated that participating in loyalty programmes was no longer beneficial. Studies conducted by Mendoza and Gonzalez (2016), Blanco-Justicia and Domingo-Ferrer (2016) and Corine et al. (2004) indicate that customers had no interest in participating in loyalty programmes because they felt that loyalty programmes do more harm than providing benefits. Moreover, customers felt businesses will sell their data to third parties, and because of that, customers were discouraged to participate in loyalty programmes.
The study revolved around the following research question: To what extent do the residents of Ngaka Modiri Molema District participate in loyalty programmes?
2. Literature review
Customers
Customers are individuals or organisations that buy goods and services from businesses. According to Rahman and Safeena (2016), customers will use the money that they have earned through hard work to purchase goods and services that will meet their needs. According to Srihadi and Satiawan (2015), businesses must put in the effort in understanding the factors that customers consider before purchasing goods and services.
Customer satisfaction
Customer satisfaction occurs when the actual service or products of the business meet the expectations of customers physically, emotionally, and psychologically during the transaction process. According to Kruger (2016), customer satisfaction can only occur once the service has been rendered and the products have been consumed. Rahman and Safeena (2016) indicate that businesses use customer satisfaction to attract new customers and retain old customers.
Customer loyalty
Customer loyalty occurs when customers buy goods and services from the business even when they have an alternative of buying elsewhere but they choose to buy from the supplier. According to Shaw and Hamilton (2016) businesses that have loyal customers benefit more because loyal customers buy more of the offerings of the business. Moreover, customers who are loyal to the business are more willing to spend more on the offerings of the businesses to be provided with a unique product and service offerings. Furthermore, loyal customers will promote the business of the supplier willingly to their friends and loved ones by telling them about the excellent product offerings and services of the supplier.
Customer-loyalty programmes
Customer-loyalty programmes are rewards that businesses offer to their loyal customers to encourage them to buy more often of the products and services of the business. According to Gorajski and Machowska (2019), loyalty programmes encourage repeat purchase and increase the profits of the firm. Dube (2016) indicates that loyalty programmes satisfy customers’ needs by providing them with personalised rewards. Nandal et al. (2020) emphasize that loyalty programmes are an exceptional device to attract new customers and retain existing ones. Madhovi (2014) emphasizes that loyalty programmes are a significant part of strategically building continuous relationships with customers.
Many theories are used in research studies; however, this study focused on the Social Comparison Theory and Consumerism Theory.
According to Miller et al. (2007), comparisons among people play a major role in social life; moreover how people perceive their situations, capabilities, and conduct is different based on the types of social comparisons people make. Furthermore, social comparison generally refers to how people think about themselves while looking at other people. Additionally, people compare themselves to others for self-validation purposes, self-improvement purposes, and to make themselves better compared to a person who is in a worse situation or condition.
The Social Comparison Theory was relevant to this study because customers who participate in loyalty programmes will compare themselves against customers who are not yet members of loyalty programmes. Customers who are members of tier loyalty programmes are mostly the ones who will compare themselves against ordinary customers. Customers who are members of a hotel tier loyalty programme at the platinum level (top level) will think that they are much better in value than customers who are at the bronze level (lower level).
Consumers normally desire to meet their needs with their available resources. According to Ward and Lasen (2009) if the incomes of people in developing countries are increased, such people will spend more money on necessities such as food to meet their needs. This theory applies to loyalty programmes in the context of South Africa where if the incomes of households are increased, more necessities will be bought, and more loyalty rewards points will be earned. The more people can buy goods and services the more they are encouraged to participate in loyalty programmes and earn rewards.
This literature review consulted secondary data sources including books, academic journals, newspaper articles, state publications, and census reports.
Meyer-Waarden (2015) defines loyalty programmes as the incentives that companies offer to their loyal customers to encourage repeat purchase and build long-term relationships with them. Without a doubt, there have been several studies that are of the view that loyalty programmes are tools that are used to encourage repeat purchases by customers and to establish long-term relationships with them (Lewis, 2004; Kang et al.,2015; Magatef & Tomalieh, 2015). Sungirirai et al. (2017) add that loyalty programme owners have been advancing their loyalty programmes to attract and gain the attention of customers.
Although many studies view loyalty programmes as tools for establishing long-term relationships and increasing customer retention, some researchers hold a different view. Rosidah and Asiah (2009) strongly believe that loyalty programmes are used as tools to attract, choose the customers, and keep them within the business by taking advantage of them. The researchers think that loyalty programmes are beneficial to customers in three ways. Firstly, customers benefit economically in the form of getting cash discounts and cash savings. Secondly, customers benefit socially by experiencing a sense of belonging when they meet customers of similar interests. Finally, customers benefit psychologically by feeling valued by the stores when they receive special treatment that ordinary customers do not receive.
Statistics on multiple studies conducted in the past and present refute the claims that are made by Rosidah and Asiah (2009). Statistics show that in the past years the number of customers who are joining loyalty programmes has been significantly increasing, which may suggest that customers are seeing loyalty programmes as valuable. A study conducted by Colloquy (2015) in the U.S. shows that there were 2.6 billion customers enrolled for loyalty programmes in 2012 and in 2014 there were 3.3 billion customers registered for loyalty programmes in the U.S. Additionally, a study conducted by Olivier and Burnstone (2014) in South Africa also showed a significant increase in the number of loyalty-programme members over the years. The study shows that in 2011 there were 47.2 million loyalty-programme members, in 2012 there were 64.6 million loyalty-programme members and in 2014 there were 82.8 million loyalty-programme members in South Africa.
Companies use loyalty programmes for several reasons. Firstly, companies use loyalty programmes to build a long-term relationship with customers and boost the company’s revenue by encouraging repeat purchase (Kang et al., 2015). Secondly, companies use loyalty programmes to encourage customers to remain loyal to the company and curb competition from rivalry (Dario & Goran, 2015). Finally, companies also use loyalty programmes to influence the purchasing behaviour of customers (Dlamini & Chinje, 2019)
There are several types of loyalty programmes. Firstly, there are membership-based loyalty programmes where members are rewarded for purchasing selected products. Secondly, there are frequent-buyer loyalty programmes where customers buy more often to get additional services for free. Thirdly, there are partnership-based loyalty programmes where companies join forces to offer collective benefits to customers. Additionally, there are point-based loyalty programmes where customers earn points as they buy and redeem them later (Magatef & Tomalieh, 2015). Finally, Svensson and Tran (2014) add that there is a tier-system loyalty programme where customers will have to reach maximum points to proceed to the next level.
According to The Truth and BrandMapp Loyalty Whitepaper (2016), customers join loyalty programmes to (1) earn discounts and save on cash; (2) reach the highest milestone to earn bigger rewards, vast discounts and win prizes during competitions; and (3) be recognized and get a sense of belonging. Some customers do not join loyalty programmes because they fear that their information will be disclosed to third parties (Blanco-Justicia & Domingo-Ferrer, 2016). Some customers also do not join or use loyalty programmes because they do not appeal to their needs; they feel earning points is not worth the effort and points expire before they can use them (Eighty20 & Tritech Media, 2018). The current study incorporated the perception of Ngaka Modiri Molema District residents on loyalty programmes because there has not been a loyalty programme study conducted in the area.
3. Research methodology
The study followed a quantitative research approach, and the target respondents of the study were the employed residents of Ngaka Modiri Molema District who were within the ages of 20-54 years on the basis that they are working and make significant household purchasing decisions. It was challenging to obtain a complete sampling frame of the population; because of that, the non-probability sampling technique was used.
3.1 Sampling strategies
The target population of the study was 146 936 residents of Ngaka Modiri Molema District who were working and were earning a salary when the study was conducted. The targeted sample of the study consisted of 598 Ngaka Modiri Molema District residents who were working and were earning a salary when the study was conducted. A quantitative research approach was applied. The list of the elements of the study could not be obtained; because of that, the study opted to use a non-probability sampling. According to Kumar (2019: 481), non-probability sampling is applied when the number of elements in a population is either known or cannot be individually identified. A survey is a structured way of obtaining data from (a sample of) individuals to establish quantitative descriptors of the characteristics of the larger population (Avedian, 2014:2).
The study conducted applied-purposive sampling to identify the respondents who were suitable to participate in the study. Purposive sampling refers to a type of non-probability sampling in which the objective of the researcher is to strategically sample cases or participants so that those sampled are appropriate to the research questions asked (Bryman & Bell, 2015:727). The researcher purposively selected the 598 respondents who were based in Ngaka Modiri Molema District and were between the ages of 20-54 years on the basis that they were working and earning a salary when the study was conducted.
Immediately after that, snowball sampling was applied by requesting the respondents who participated in the study to refer other respondents who had similar characteristics to also participate in the study. According to O’Leary (2017:211), snowball sampling refers to the process of forming samples through referrals. The researcher requested the respondents who were initially identified to recommend other population members who met the set criteria of the study. A total of 598 online surveys hosted on Google Docs were distributed online using professional working sites such as LinkedIn, Social Networks such as Facebook, Twitter, and WhatsApp. Respondents through public spaces were allowed to access the online surveys through face-to-face interactions, and other respondents were able to access the online surveys through referrals.
4. Results
4.1 Response Rate
A total of 598 online questionnaires were distributed online; only 312 questionnaires out of 598 questionnaires were completed and submitted. Therefore, the response rate was 52%.
Table 4.1 provides a socio-demographic profile of the respondents who participated in the study. The study was mostly dominated by female respondents (68%) and most of the respondents were within the age group of 18-24 years and 25-34 years. Most of the respondents (61%) were earning less than R15 000. The majority of the respondents (31%) had a Matric certificate.
Table 4.1: A Socio-demographic profile of the respondents
|
Gender |
Frequency |
Percentage |
|
Female |
211 |
67,63 |
|
Male |
98 |
31,41 |
|
Other |
3 |
0,96 |
|
Total |
312 |
100 |
|
Age category |
Frequency |
Percentage |
|
18-24 years |
147 |
47,12 |
|
25-34 years |
142 |
45,51 |
|
35-44 years |
19 |
6,09 |
|
45-55 years |
4 |
1,28 |
|
Total |
312 |
100 |
|
Income category |
Frequency |
Percentage |
|
<R15 000 |
189 |
60,58 |
|
R15 000-R24 999 |
48 |
15,38 |
|
R25 000-R34 999 |
16 |
5,13 |
|
R35 000-R44 999 |
6 |
1,92 |
|
R45 000-R55 999 |
3 |
0,96 |
|
Non-disclosure |
50 |
16,03 |
|
Total |
312 |
100 |
|
Qualification |
Frequency |
Percentage |
|
Below matric |
72 |
23,08 |
|
Matric |
96 |
30,77 |
|
Technikon diploma/degree |
48 |
15,38 |
|
University degree |
61 |
19,55 |
|
Honours |
26 |
8,33 |
|
Masters |
9 |
2,88 |
|
PhD |
0 |
0,00 |
|
Total |
312 |
100 |
The bar graphs to follow provide the data that were collected to answer the research questions.
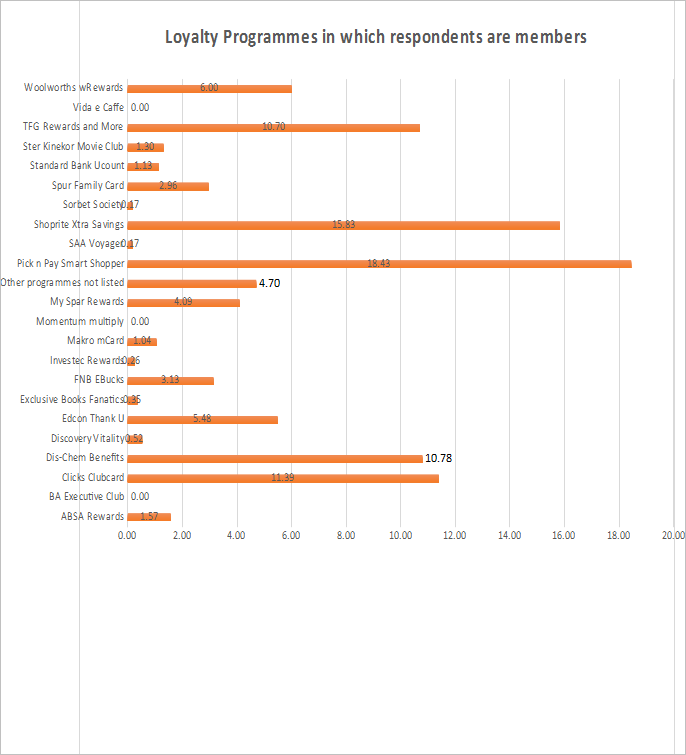
4.2.1. Loyalty programme(s) in which respondents are members
The loyalty programmes of which the respondents were members are detailed in Figure 4.1 below. The information was used to identify loyalty programmes in which most of the respondents participated. The respondents were allowed to select more than one option. The answers from the 312 respondents are summarized in Figure 4.1. Pick ‘n Pay Smart Shopper had the most members (18%), followed by Shoprite Xtra Savings (16%), Clicks Clubcard (11.39%), Dis-chem Benefits (10.78%), and TFG Rewards and More (10.70%). Grocery retail, health, and the retail clothing industry are among the sectors where respondents were members of loyalty programmes.
According to a related study conducted by Eighty20 and Tritech Media (2018), Pick n’ Pay (85%) had the most involved participants, led by Woolworths WRewards (81%), Clicks Clubcard (78%), Dischem Benefits (78%), and My Spar Rewards (62%). According to The Truth & BrandMapp Loyalty Whitepaper (2016), most of the respondents were members of Pick n’ Pay Smart Shopper (68%) followed by Clicks Clubcard (59%) and Woolworths WRewards (59%) among other loyalty programmes. A similar study conducted by Olivier and Burnstone (2014) indicated that the retail sector had the most members by 77%. A similar study conducted by Colloquy (2015) indicated that most of the respondents (39%) were members of loyalty programmes based in the retail sector including grocery retail and health stores.
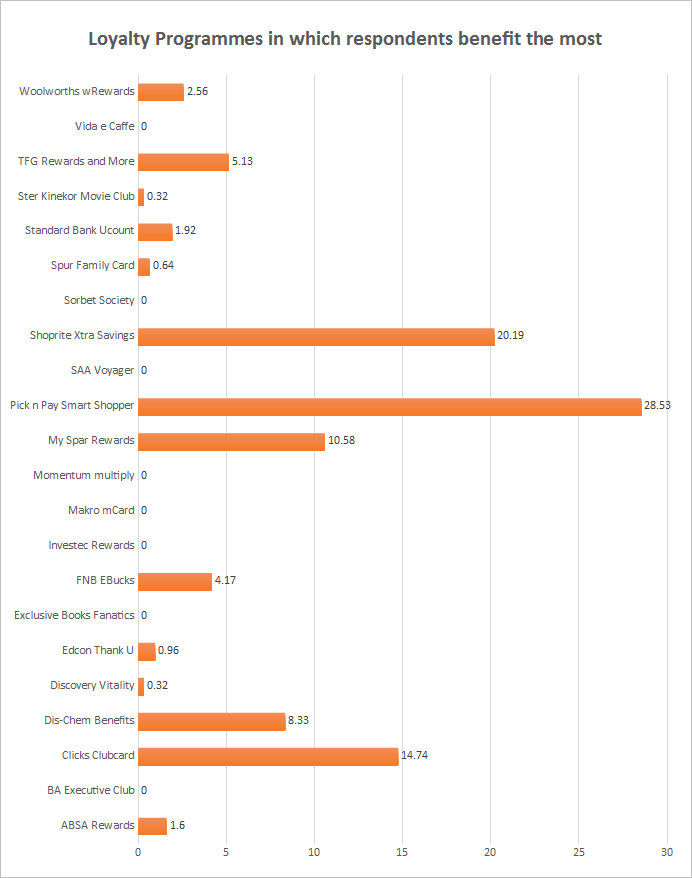
4.2.2 Loyalty programmes in which respondents benefit the most
Figure 4.2 provide detailed statistics on the loyalty programmes that the respondents were benefiting the most from. The data was collected to identify the loyalty programmes in which the respondents received more benefits than in any other loyalty programme.
As shown in Figure 4.2, most respondents (29%) indicated that Pick n’ Pay Smart Shopper offered the most benefits, followed by Shoprite Xtra Savings (20%), Clicks Clubcard (15%), My Spar Rewards (11%) and Dis-Chem Benefits (8%). Most of the programmes that the respondents benefited from were in the grocery retail and health care industries. Figure 4.2 correspond to Figure 4.1, where Pick n’ Pay Smart Shopper was also the most prevalent, followed by Clicks Clubcard and Shoprite Xtra Savings. Most respondents benefited from grocery store loyalty programmes such as Pick n’ Pay Smart Shopper and Shoprite Xtra Savings because food is necessary for survival and is bought on a more frequent basis than any other commodity. Furthermore, since people are frequently in need of medical supplies, most of the respondents benefited from health-related loyalty programmes such as Clicks Clubcard and Dis-Chem Rewards. According to a similar study conducted by Eighty20 and Tritech Media (2018), most of the respondents benefited from Pick n’ Pay Smart Shopper (58%) led by Woolworths WRewards (43%) and Clicks Clubcard (33%).
According to The Truth and BrandMapp Loyalty Whitepaper (2020), Pick n’ pay Smart Shopper is the most beneficial loyalty programme in the retail grocery sector with 24% of Pick n’ Pay Smart Shopper members reporting that it is their top loyalty programme. This is closely followed by Clicks Clubcard (23%) and Dis-Chem Benefits by 15% in the health industry.
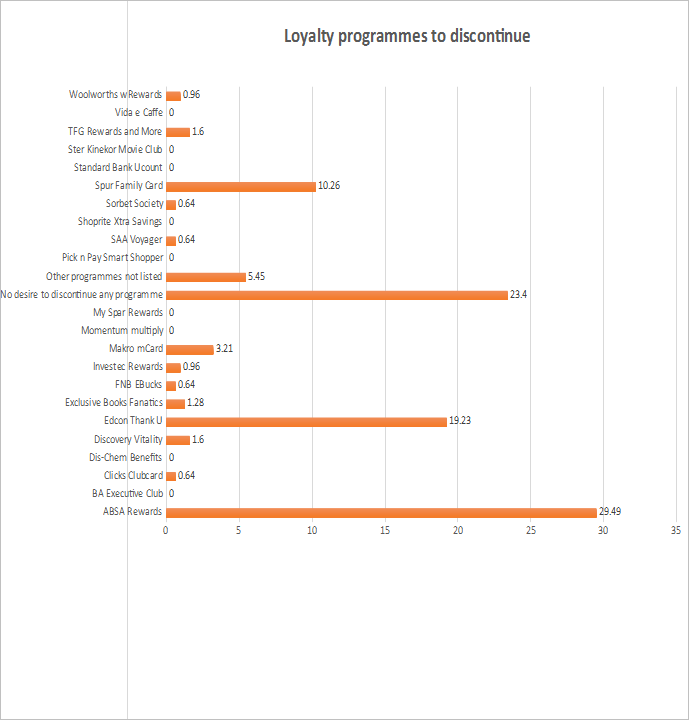
4.2.3 Loyalty programmes in which respondents are members but would want to discontinue their membership
Figure 4.3 provides detailed statistics on loyalty programmes that the respondents were participating in but would want to discontinue. The data was collected to identify the loyalty programmes that respondents were participating in but were less beneficial to the respondents.
Most respondents (29%) wished to cancel their ABSA Rewards programme, followed by 19% of respondents who wished to cancel their Edcon Rewards programme, followed by 10% of the respondents who wished to cancel their Spur Family Card, followed by 5% of the respondents who wanted to cancel other loyalty programmes that the researcher did not mention by name. In addition, 23% of the respondents did not have the desire to cancel any loyalty programme as shown in Figure 4.3. The programmes that the respondents wanted to cancel were within the banking, retail clothing and fast-food industry. The data provided in Figure 4.3 correlates with the data provided by Figure 4.2 because the respondents wanted to cancel loyalty programmes with the least benefits. According to a similar study conducted by Colloquy (2015), an average household in the United States of America stopped using 58% (17 out of 29) of the loyalty programmes they registered for.
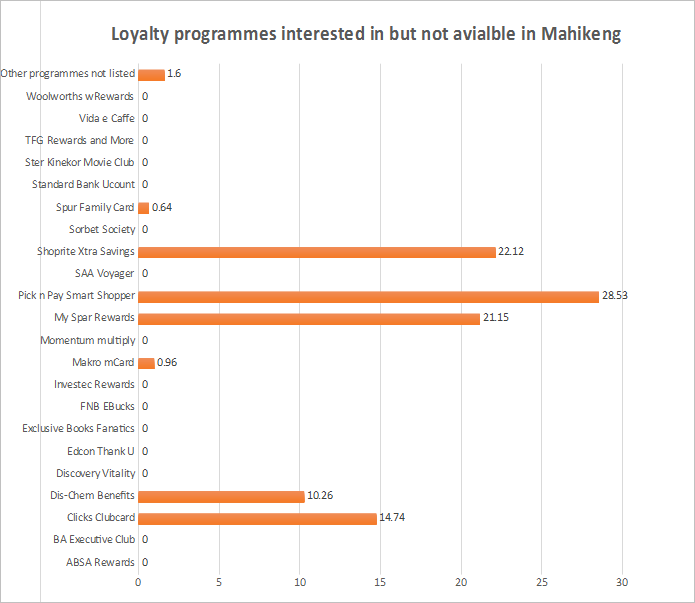
4.2.4 Loyalty programmes that respondents want to participate in but are not available in rural areas around Mafikeng
Figure 4.4 provides detailed statistics on the loyalty programmes which the respondents wished were available in the rural areas around Mahikeng. The data were collected to understand the loyalty programmes that the respondents valued but were currently unavailable in the respondents’ closest stores.
Most of the respondents wanted to have Pick n’ Pay Smart shopper with 29% in the rural areas around Mahikeng, followed by Shoprite Xtra Savings with 22%, My Spar Rewards with 21%, followed by Clicks Clubcard with 15%, and Dis-Chem Benefits with 10% as shown in Figure 4.4. The loyalty programmes that the respondents wanted to have in the rural areas around Mahikeng were within the grocery retail and the health industry. By looking at Figure 4.1, Figure 4.2, and Figure 4.3 there is a trend where most loyalty programmes were about food and health.
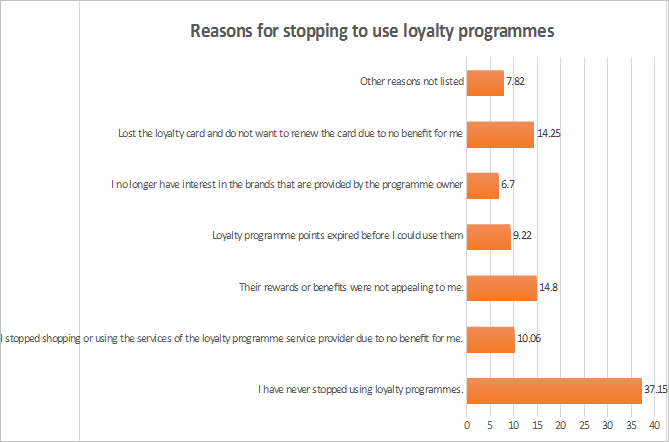
4.2.5 Main reasons that may have stopped the respondents from using loyalty programmes
Figure 4.5 provides detailed statistics on the reasons that have stopped the respondents from using some of the loyalty programmes. The data were collected to understand the factors that resulted in customers stopping to use some of the loyalty programmes.
In Figure 4.5, the 312 respondents provided reasons that caused them to stop using or participating in loyalty programmes. Some respondents chose only one option, while some respondents chose more than one option; therefore, a number of 358 responses was received. Most of the respondents (37%) have never stopped using loyalty programmes, followed by 15% who found the rewards provided by loyalty programmes to be unappealing. The results also indicated that 14% of the respondents stopped participating in loyalty programmes because the respondents lost loyalty cards and did not want to renew/replace the loyalty cards as shown in Figure 4.5.
According to a similar study conducted by Marques et al. (2017), most respondents (37%) did not engage in loyalty programmes because the respondents were unaware of loyalty programmes and 16% of the respondents thought that the benefits of loyalty programmes do not justify the need to join loyalty programmes. According to a similar study conducted by Eighty20 and Tritech Media (2018), 48% of respondents indicated that participating in loyalty programmes is not beneficial. Furthermore, 47% of those who responded to the survey had stopped using the service provider’s services. Finally, 50% of the respondents never used the points or benefits earned.
In a study that was conducted by The Truth and BrandMapp Loyalty Whitepaper (2020), 38% of the respondents indicated that the rewards were irrelevant to personal needs. Furthermore, 37% of the respondents were no longer interested in loyalty programmes because loyalty points expired before the respondents could use them. Additionally, 25% of the respondents were not using/had stopped using loyalty programmes due to not making enough purchases to earn decent rewards. In a similar global study conducted by KPMG International (2019), 28% of the respondents from Germany were no longer/not participating in loyalty programmes due to the tracking of purchasing behaviour by the loyalty-programme operators. Furthermore, 69% of the respondents (millennials) who took part in the study indicated that loyalty programmes were too hard to join and/or earn rewards.
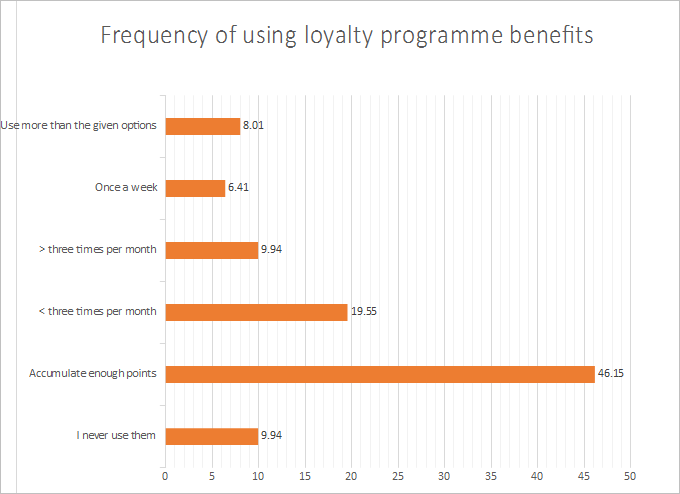
4.2.6 How often do the respondents use the benefits on the loyalty cards
Figure 4.6 provides brief detailed statistics on the number of times in which the respondents of the study used the benefits provided by loyalty cards in which the respondents were mostly participated in. The information provided by the collected data aided in assessing the frequency in which the respondents of the study were using the benefits of the loyalty programmes in which they were mostly participating in.
Most of the respondents (46%) waited to accumulate enough points before using the benefits, followed by 20% of the respondents who were using loyalty points benefits less than three times per month as shown in Figure 4.7. A similar study conducted by Eighty20 and Tritech Media (2018) indicated that 50% of the respondents never used the earned loyalty points or benefits and 32% of the respondents waited until the points or rewards expired without being claimed. In a similar study conducted by The Truth and BrandMapp Loyalty Whitepaper (2020), 35% of the respondents were using loyalty programme benefits in the same manner as the previous year. According to a study conducted by Oracle (2020), 77% of respondents (millennials) were only redeeming or using their loyalty programme benefits once every quarter.
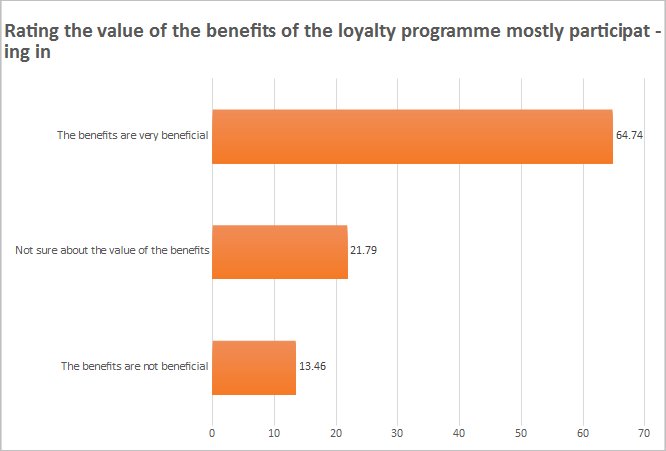
4.2.7 Rating the value of the benefits of the loyalty programme mostly participating in
Figure 4.7 below provides the perceptions of the respondents on the value of the benefits of the loyalty programme in which the respondents were mostly participating in. The rating of the value of the benefits was done to be able to measure the respondent’s level of satisfaction with the benefits of the loyalty programme in which the respondents were mostly participating in.
Most of the respondents (65%) regarded the value of the benefits of the loyalty programme in which they were mostly participating in as very beneficial, followed by 22% of the respondents who were unsure about the value of the benefits of the loyalty programme where the respondents were mostly participating in as shown and Figure 4.7.
According to a similar study conducted by The Truth and BrandMapp Loyalty Whitepaper (2016), 23% of respondents considered loyalty-programme benefits to be beneficial, 39% found loyalty programme benefits to be very beneficial, and 35% found loyalty programme benefits to be not very beneficial. According to Sungirirai et al. (2017), most of the respondents (41%) were somewhat pleased with loyalty programme benefits, while 31% were very satisfied. In a study done by Dube (2016), 34% of the respondents indicated that loyalty-programme benefits were satisfactory (beneficial). In a similar study conducted by the Truth and BrandMapp Loyalty Whitepaper (2020), the majority of respondents (63%) indicated that loyalty programs were most beneficial through cash backs, with 45% indicating that loyalty programmes were most beneficial through cash vouchers.
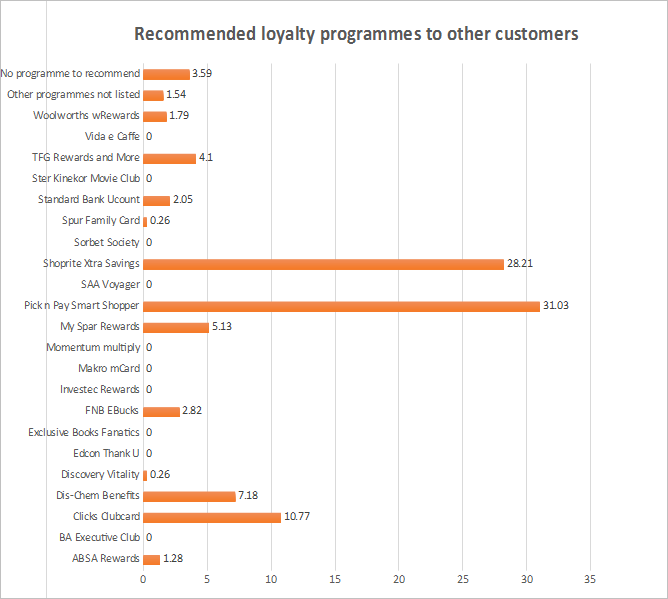
4.2.8 Programmes that respondents would recommend to other customers
Figure 4.8 provides detailed statistics on loyalty programmes that the respondents would recommend to other customers. This information helped to identify the loyalty programmes that the respondents were satisfied with and confident about based on the value obtained from participating in the selected loyalty programmes. The 312 respondents could provide more than one option and 390 responses were received in total.
Most of the respondents (31%) would recommend Pick n’ Pay Smart Shopper to other customers, followed by Shoprite Xtra Savings with 28%, Clicks Clubcard with 11% and Dis-Chem Benefits with 7% as shown in Figure 4.8. Most of the loyalty programmes that the respondents would recommend to other customers belonged to the grocery retail and the health industry. According to a study conducted by The Truth and BrandMapp Loyalty Whitepaper (2020), respondents under the age of 35 will most likely recommend Pick n’ Pay Smart Shopper to family, friends, and loved ones with 72%, followed by Clicks Clubcard with 70%, and Dis-Chem benefits with 62%.
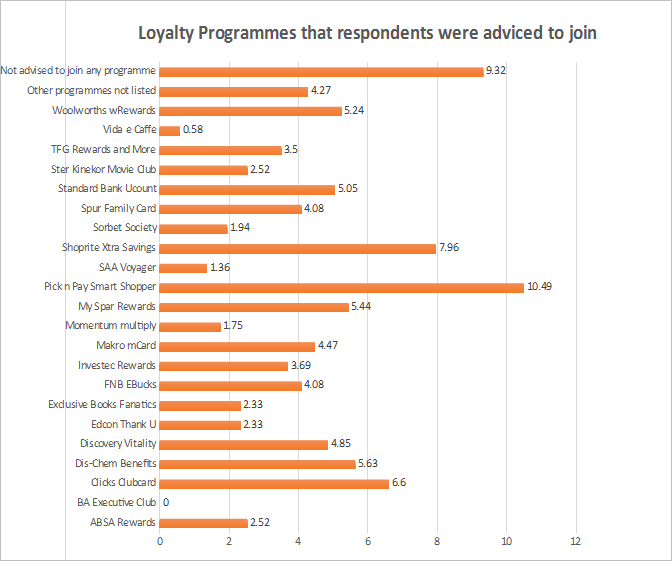
4.2.9 Loyalty programmes that the respondents were advised to join by cashiers, friends, and family
Figure 4.9 provides detailed statistics on loyalty programmes that the respondents were advised to join by the cashiers, friends, and family or a combination of the three. This information provided an idea of the loyalty programmes that the respondents value and would want their friends, family, and loved ones to also benefit from.
Most of the respondents (10%) were advised to join Pick n’ Pay Smart Shopper, followed by Shoprite Xtra savings with 8%, Clicks Clubcard with 7% and Dis-chem Benefits with 6%. Additionally, 9% of the respondents were not advised to join any loyalty programme as shown in Figure 4.9. Most of the respondents were advised to join loyalty programmes in the grocery retail and health industry.
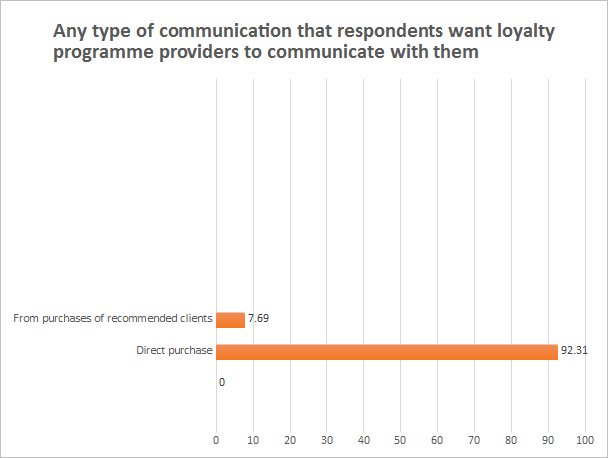
4.2.10 Any type of communication that respondents want loyalty programme providers to communicate with them
Figure 4.10 provides detailed statistics on how the respondents wanted loyalty programme providers to communicate with them regarding loyalty programme activities such as points update, promotion or sales information. Most of the respondents (63%) preferred loyalty programme operators to use SMS to communicate with them about loyalty programme information, followed by 26% of the respondents who preferred to be communicated with using WhatsApp as shown in Figure 4.10.
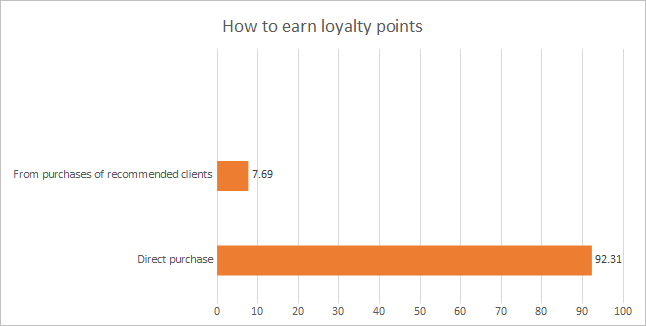
4.2.11 Methods of preference for earning loyalty points
Figure 4.11 provides detailed statistics on the methods that the respondents preferred to earn loyalty points.
Most of the respondents (92%) preferred to earn loyalty points through direct purchase as shown in Figure 4.11.
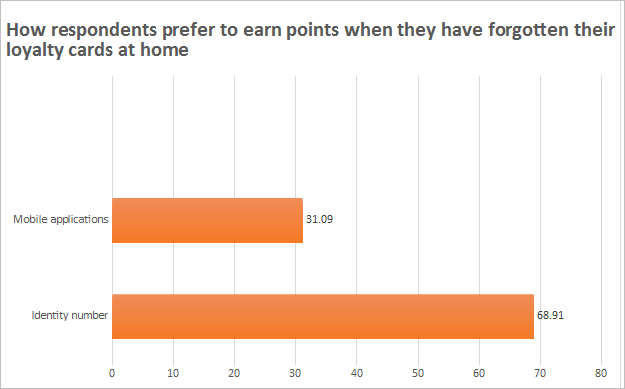
4.2.12 How respondents prefer to earn loyalty points when they have forgotten their loyalty cards at home
Figure 4.12 provides statistics on the different ways that the customers may use to earn their loyalty points when the respondents had forgotten loyalty cards at home. Respondents could earn loyalty points by providing Identity Numbers to the cashiers as the loyalty cards were linked to the Identity Numbers of the respondents. In some loyalty programmes, the respondents could present their Mobile Applications for the cashiers to scan the virtual card.
Most of the respondents (69%) preferred to earn and redeem loyalty points by providing Identity Numbers to the Cashiers when the respondents had forgotten the loyalty cards at home. A minority (31%) preferred to use loyalty-programme mobile applications to claim and redeem loyalty points when the respondents had forgotten loyalty cards at home as shown in Figure 4.12. In a similar study conducted by Nielsen (2017), 60% of the respondents indicated a stronger preference for loyalty programmes that allow customers access to loyalty-programme mobile applications of the stores to conduct transactions that can also be done using a physical loyalty card.
5. Factors of importance
The following factors were of significance from the descriptive statistics mentioned:
The most valued loyalty programmes were Pick n’ Pay Smart Shopper, Shoprite Xtra Savings, Clicks Clubcard, and Dis-Chem Benefits. Most loyalty programmes where the respondents were members were within the grocery retail and the health industry. Around 65% of the respondents rated the value of the loyalty programme benefits where the patrons mostly participated in as very beneficial. The grocery retail and health industry accounted for 82% of loyalty programmes that were most beneficial to customers.
Most of the respondents (46%) waited until the respondents had accumulated enough points before they could use the loyalty cards benefits. Around 92% of the respondents preferred to earn loyalty points through direct purchase compared to the purchase of recommended clients by the respondents. Almost 63% of the respondents preferred to be communicated with through SMS. Most of the respondents (69%) preferred to earn and redeem loyalty points using Identity Numbers when the respondents had forgotten loyalty cards at home. The loyalty cards of the respondents were linked to identity numbers.
6. Discussion
This study investigated the level at which the employed residents of Ngaka Modiri Molema District were participating in loyalty programmes. To the knowledge of the researcher, this is the first study to measure the level of participation in loyalty programmes by the employed residents of Ngaka Modiri Molema District.
6.1 Summary of findings
The findings of the study indicate that most of the employed residents in Ngaka Modiri Molema District are participating in loyalty programmes that are within the retail grocery and health industry. About 82% of the respondents had loyalty programmes that were within the grocery retail and health industry. Most of the loyalty programmes that the respondents participated in and received the most benefits from include Pick n’ Pay Smart Shopper, Shoprite Xtra Savings, Clicks Clubcard, and Dis-Chem Benefits. The findings of this study are consistent with similar studies that were conducted in the past (Olivier & Burnstone, 2014; The Truth & BrandMapp Loyalty Whitepaper, 2016 & 2020; Eighty20 & Tritech Media, 2018: & Colloquy, 2015).
6.2 Managerial implications
The findings of the study indicate that the employed residents of Ngaka Modiri Molema District have a high preference for loyalty programmes in the retail grocery and health industry. Loyalty programme operators in the retail grocery industry and the health industry need to ensure that customer participation in their industries is maintained and that the interest shown by customers is continuously enhanced. The findings of the study suggest a need for loyalty programme operators in other industries to redesign their loyalty programmes in such a way that they offer appealing benefits and encourage customer participation. There is a need for loyalty programme operators to attend to issues that discourage customers from participating in loyalty programmes.
6.3 Limitations and directions for future research
The study’s limitation is that it was conducted primarily through an online survey in the Ngaka Modiri Molema District of the North-West Province; thus, the findings cannot be extended to the rest of the country. Due to employment loss during the pandemic, some potential responders were unable to participate in the survey. The current study only included residents of the Ngaka Modiri Molema District who were working at the time the study was conducted and had internet access. Future studies should consider employing pencil and paper surveys, as well as integrating the perspectives of unemployed citizens who get social grants to be able to buy products and services.
7. Conclusions and recommendations
The study aimed to enhance participation in loyalty programmes by the employed residents of Ngaka Modiri Molema District. It was discovered that most of the employed residents of Ngaka Modiri Molema District were participating in retail grocery and the health industry loyalty programmes. The most used and beneficial loyalty programmes for the employed residents of Ngaka Modiri Molema District included Pick n’ Pay Smart Shopper, Shoprite Xtra Savings, My Spar Rewards, Clicks Clubcard, and Dis-Chem Benefits. Although participation in loyalty programmes in the retail grocery and hospitality industry is impressive, there is a need for loyalty-programme operators in industries such as hospitality, banking, entertainment, and other industries to improve the benefits of their loyalty programmes and design their loyalty programmes in such a way that they are attractive, appealing, and encourage continuous customer-loyalty programme participation. With that in mind, the following measures need to be considered by loyalty-programme operators in Ngaka Modiri Molema District to enhance customer participation in loyalty programmes:
-
Loyalty-programme operators need to clearly define their loyalty-programme objectives.
-
Loyalty-programme operators need to clearly define loyalty-programme benefits for customers and the business.
-
Loyalty-programme operators need to train their employees (cashiers) and provide guidelines on how to recruit customers to join loyalty programmes.
-
Businesses should encourage employees to make loyal customer recruitment to join loyalty programmes among the top priorities of top customer service.
-
Businesses must research the purchasing behaviour of customers to understand and identify the products that customers purchase more often.
-
Businesses must align the loyalty-programme benefits with the products that customers purchase more often.
-
Businesses must continuously update customers about loyalty-points updates and the benefits due to the members of loyalty programmes.
In conclusion, loyalty-programme operators in Ngaka Modiri Molema District should put the effort into determining how operating loyalty programmes will benefit both the businesses and the loyal customers. Although businesses want to build long term-relationships with customers, the efforts put into running loyalty programmes should also result in financial gain for the businesses.
Bibliography
Avedian, A. 2014. Survey design. http://hnmcp.law.harvard.edu/wp-content/uploads/ 2012/02/Arevik-Avedian-Survey-Design-PowerPoint.pdf Date of access: 09 Nov. 2020.
Blanco-Justicia, A. & Domingo-Ferrer, J. 2016. Privacy-aware loyalty programs. Journal of Computer Communications, 100(82):83-94.
Bryman, A. & Bell, E. 2015. Business Research Methods. 4th ed. United States of America: Oxford University Press.
Businesstech. 2018. These are the best loyalty programmes in South Africa. https://businesstech.co.za/news/finance/279973/these-are-the-best-loyalty-programmes-in-south-africa/ Date of access: 24 Jul. 2019.
Colloquy. 2015. The Colloquy Loyalty Census. https://www.petrosoftinc.com/wp-content/uploads/2018/03/2015-loyalty-census.pdf Date of Access: 12 Jun. 2019.
Corine, N., Pieter, P. & Gaby, O.S. 2004. The effect of customer card programs. A comparative study in Singapore and The Netherlands. International Journal of Service Industry Management, 15(4):351-364.
Dario, D. & Goran, P. 2015. Loyalty programs in grocery retailing: Do customers provoke a tiered rewarding system? Journal for International and European Law, Economics and Market Integrations, 9(1):9-25.
Dlamini, S. & Chinje, N.B. 2019. The influence of loyalty programs on South African Youth’s repeat purchase behaviour. Journal of Business and Retail Management Research, 13(3):235-247.
Dlamini, S. 2016. The mediating influence of loyalty programmes on repeat purchase behaviour in the retail sector. Johannesburg: Wits University. (Thesis-PhD).
Dube, S.E., 2016. Assessing the effectiveness of a customer loyalty programme as marketing tool in the Ezemvelo KZN Wildlife resorts. Durban: Durban University of Technology (PhD-Thesis).
Eighty20 & Tritech Media. 2018. 2018 Loyalty Programme Member Engagement Survey. http://www.eighty20.co.za/app/uploads/2018/06/2018-Loyalty-Report.pdf Date of access: 18 Jul. 2019.
Górajski, M. & Machowska, D. 2019. How do loyalty programs affect goodwill? An optimal control approach. 4OR, 17(3):297-316.
Kang, J., Alejandro, T.B. & Groza, M.D. 2015. Customer–company identification and the effectiveness of loyalty programs. Journal of Business Research, 68(2):464-471.
Kasai, C. & Chauke, M.X. 2017. Investigating Customer Perceptions of Loyalty Cards and their Influence on Purchasing Behaviour in Major Retail Stores. Journal of Marketing and HR, 5(1):302-324.
KPMG International. 2019. The Truth About Millennials. https://assets.kpmg/content/dam/ kpmg/xx/pdf/2019/11/customer-loyalty-report.pdf Date of access: 19 Jan. 2020.
Kruger, F., 2016. The Influence of Culture and Personality on Customer Satisfaction: An Empirical Analysis Across Countries. Magdeburg, Springer. https://books.google.co.za/ books?id=o2mhCwAAQBAJ&printsec=frontcover&dq=The+Influence+of+Culture+and+Personality+on+Customer+Satisfaction:+An+Empirical+Analysis+Across+Countries Date of Access: 11 Jul. 2019.
Kumar, R. 2019. Research methodology: A step-by-step guide for beginners. London. SAGE.
Lewis, M. 2004. The influence of loyalty programs and short-term promotions on customer retention. Journal of marketing research, 41(3):281-292.
Madhovi, P.G. 2014. Assessing the effectiveness of customer relationship management (CRM) in the hotels in Pretoria. Pretoria: University of South Africa. (PhD-Thesis).
Magatef, S.G. & Tomalieh, E.F. 2015. The impact of customer loyalty programs on customer retention. International Journal of Business and Social Science, 6(8):78-93.
Marques, S.H., Cardoso, M.G. & Lindeza, A.C.A. 2017. Do loyalty cards enhance loyalty in the pharmaceutical sector? Journal of Relationship Marketing, 16(2):143-162.
Mendoza, J. & Gonzalez, D. 2016. Performance of Customer Reward Programs on the Swedish Grocery Retail Market, Karlskrona, Sweden. Blekinge Institute of Technology. (Masters-Thesis).
Meyer, A. 2012. The truth about loyalty cards – an explorative study conducted in South Africa. http://psrcentre.org/images/extraimages/36.%201312023.pdf Date of access: 24 Jul. 2019.
Meyer-Waarden, L. 2015. Effects of loyalty program rewards on store loyalty. Journal of Retailing and Consumer Services: 22-32.
Miller, M.K. and Flores, D., 2007. Social comparison theory. The Blackwell Encyclopaedia of Sociology.
Nandal, M.N., Nandal, N. & Malik, R. 2020. Is Loyalty Programme as a Marketing Tool Effective? Journal of Critical Reviews, 7(6):1079-1082.
Nielsen. 2017. South African shoppers are in love with loyalty. https://www.nielsen.com/ ssa/en/press-releases/2017/south-african-shoppers-are-in-love-with-loyalty/ Date of access: 18 Jul. 2019.
O’Leary, Z. 2017. The essential guide to doing your research project. SAGE.
Olivier, D. & Burnstone, S. 2014. South African Loyalty and Rewards Survey 2014. https://www.eighty20.co.za/app/uploads/2015/07/Value-Nettwork-loyalty-and-rewards-survey-2014.pdf Date of access: 25 Nov .2019.
Oracle. 2020. How to Engage Customers Across Every Generation. https://www.oracle.com/a/ocom/docs/dc/how-to-engage-consumers-across-every-generation.pdf Date of access: 19 Jan. 2021.
PwC. 2017. PwC’s total retail 2017 – South African edition. https://www.pwc.co.za/ en/publications/total-retail.html Date of Access: 18 Jul. 2019.
Rahman, M.R. & Safeena, P.K. 2016. Customer Needs and Customer Satisfaction. In: Training Manual on Theeranaipunya – Equipping Fisherwomen Youth for Future. ICAR-Central Marine Fisheries Research Institute, Kochi: 259-262.
Rosidah, M. & Asiah, O.N. 2009. Benefits—Satisfaction—Loyalty Linkages in Retail Loyalty Card Program Model: Exploring the Roles of Program Trust and Program Commitment. ACR Asia-Pacific Advances: 252-258.
Shaw, C. & Hamilton, R. 2016. The intuitive customer: 7 imperatives for moving your customer experience to the next level. Springer. https://books.google.co.za/books? id=lrnhDAAAQBAJ&printsec=frontcover&dq=The+Intuitive+Customer:+7+Imperatives+For+Moving+Your+Customer+Experience+to+the+Next+Level Date of Access: 08 Jul. 2019.
Singh, S. 2017. Consumer perceptions of loyalty programmes offered by cosmetic retailers in Durban and on the KwaZulu-Natal North Coast. Durban: UNISA. (Thesis-PhD).
Srihadi, T.F. & Setiawan, D. 2015. The influence of different level of service characteristics and personal involvement towards consumer relational response behaviors. Procedia-Social and Behavioral Sciences, 210:378-38.
Sungirirai, A., Chiguvi, D. & Sungirirai, L. 2017. The Effect of Customer Loyalty Programs on Customer Satisfaction in the Mobile Telecommunications Sector in Botswana. International Journal of Science and Research. 6(2):1815-1824.
Svensson, D. & Tran, M., 2014. Online Loyalty Program & Type Identification: Empirical study concerning Swedish online-based loyalty programs & type identification. Sweden: Linnaeus University. (Thesis-Masters).
The Truth & BrandMapp Loyalty Whitepaper. 2016. The current state of loyalty in South Africa. https://truth.co.za/2019/wp-content/uploads/Truth-2016-Loyalty-Whitepaper-WEB_FINAL1.pdf Date of Access: 07 May 2019.
The Truth & BrandMapp Loyalty Whitepaper. 2020. The current state of loyalty in South Africa. The 2019/20 South African Loyalty Landscape. https://whyfive.co.za/wp-content/uploads/2020/03/2020-Truth-BrandMapp-Whitepaper.pdf Date of Access: 18 Jan. 2020.
Ward, D. & Lasen, M. 2009. An overview of needs theories behind consumerism. Journal of Applied Economic Sciences, 4(1):137-155.